
The Card Doesn’t Lie — But It Doesn’t Shout, Either
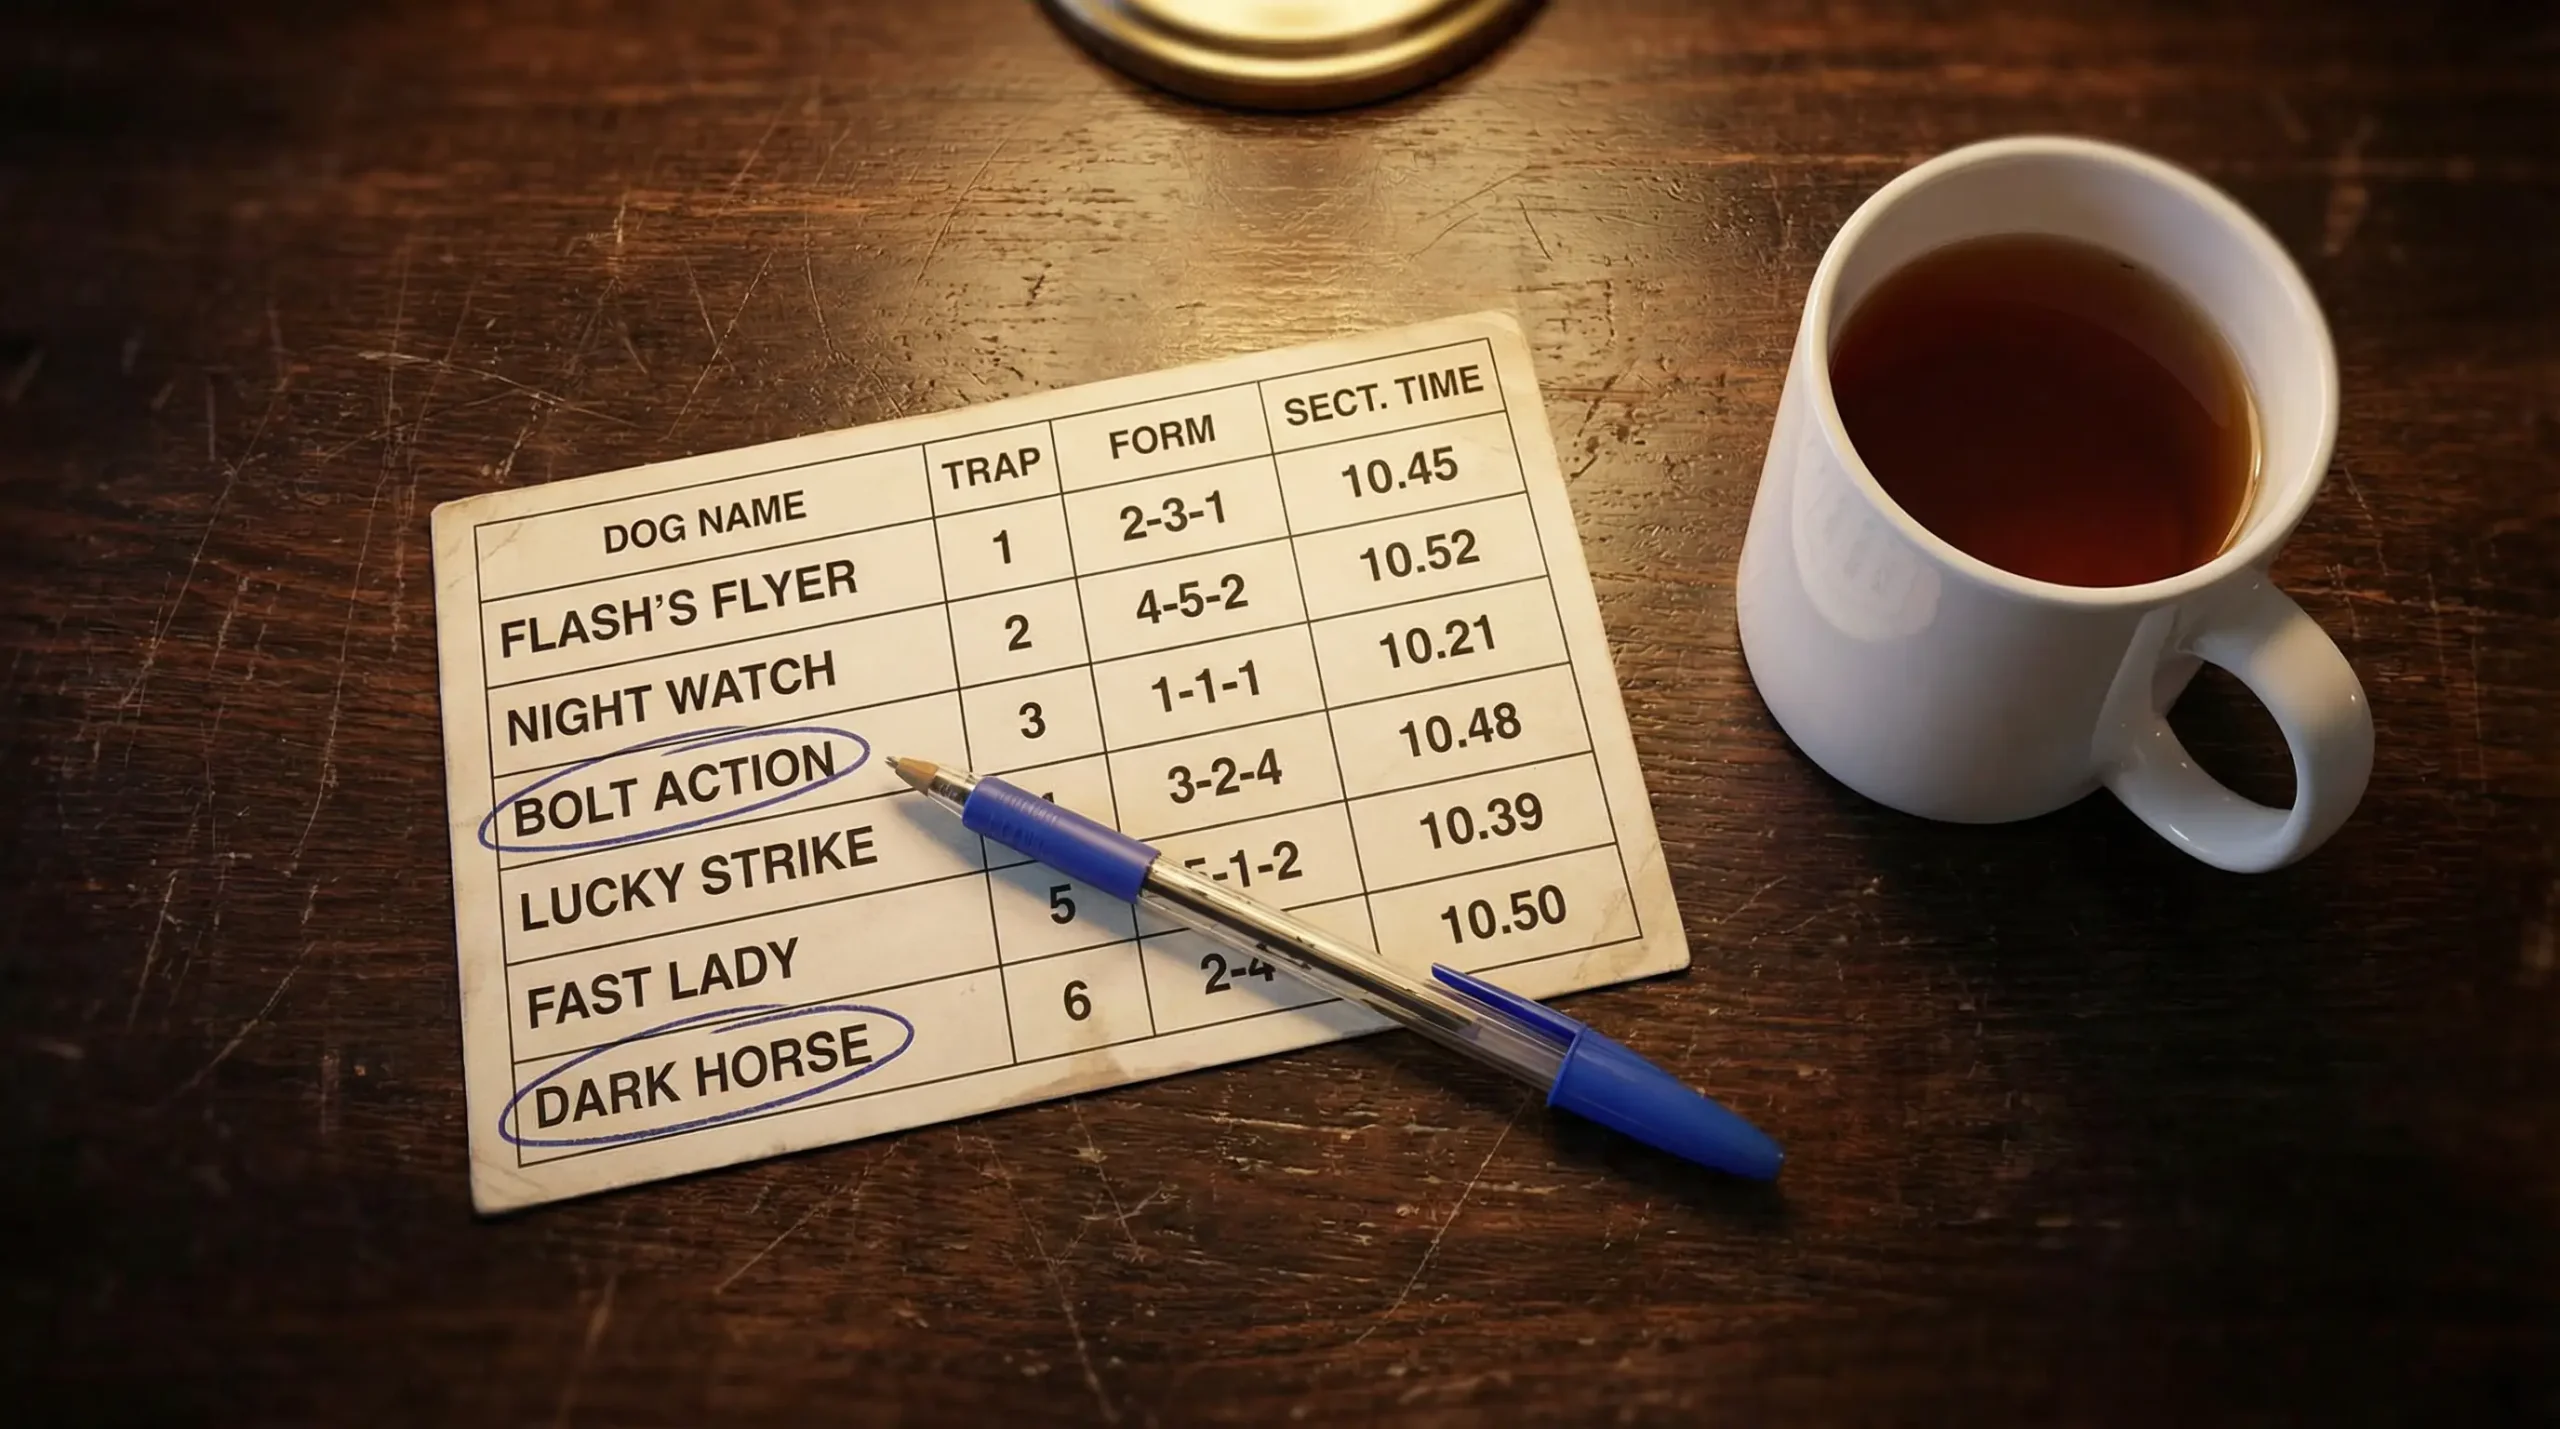
A greyhound race card is a compressed history lesson — every column encodes performance, conditions, and probability. The dog’s name tells you nothing. Its form figures tell you what happened. Its sectional times tell you how it happened. Its trap draw tells you what is likely to happen next. And the race comment, that brief sentence of shorthand buried in the detail, tells you why the numbers look the way they do. All of this information is published before every race at every licensed track in the country, freely available to anyone who looks.
The gap between the punter who reads a race card and the punter who interprets one is where the value sits. Reading is passive: you see that a dog finished third last time, note the time, glance at the trap, and move on. Interpreting is active: you ask why it finished third, whether the time was fast or slow relative to the grade, whether the trap draw helped or hindered, and whether the race comment reveals interference that the finishing position alone cannot convey. The race card does not shout its conclusions. It lays out the evidence and leaves the analysis to you.
Most casual greyhound punters look at form figures and recent finishing positions. That is a start, and it is better than nothing, but it is also where the market has already done its work. The bookmaker’s odds incorporate the obvious form signals — recent winners are short, recent losers are long — and the price you see already reflects what the numbers say on the surface. The edge comes from going deeper: reading the context behind the figures, understanding the track-specific meaning of the data, and building a picture of how the race will unfold before the traps open.
This guide breaks down the UK greyhound race card element by element. It explains what each piece of data means, how to use it, and how to combine the individual components into a coherent pre-race assessment. The mechanics are not complicated. The discipline to apply them consistently, race after race, is where the challenge and the reward both live.
Anatomy of a UK Greyhound Race Card
The standard race card format has not changed much in decades, but what experienced punters extract from it has. A modern race card, whether accessed in print at the track or digitally through a form service, presents the same core data for each runner: identity, form, speed, physical condition, and trap allocation. The layout varies slightly between providers, but the information categories are consistent across the GBGB circuit.
Dog Name, Trainer, and Ownership Details
The dog’s name heads the entry. Beside it, you will find the trainer’s name and, depending on the card format, the owner’s name. The trainer is the more analytically useful piece of information. Certain trainers have measurable records at specific tracks — higher strike rates, consistent preparation of dogs for particular distances, or a tendency to place dogs where they will be competitive rather than outclassed. Over time, a punter who tracks trainer performance builds a dataset that adds a layer of context to every race card entry.
Trainer form is particularly relevant when a dog is making its debut at a venue or stepping up in grade. A trainer with a proven record of successfully transitioning dogs between tracks gives you a reason to trust the move. A trainer whose dogs consistently underperform at a specific venue gives you a reason to doubt. Neither signal is definitive, but both are informational, and the race card hands them to you alongside the dog’s identity if you choose to use them.
Form Figures and What They Mean
Form figures are the sequence of recent finishing positions displayed as a string of digits. A form line of 2-1-3-1-4 tells you the dog finished second, first, third, first, and fourth in its last five runs, reading from most recent on the right to oldest on the left. Some cards display six or more runs; others show the last four. The convention varies, but the principle is the same: recent results, presented in chronological order.
The figures are the first thing most punters look at, and they provide a rough outline of current form. A dog showing 1-1-1 is clearly in winning form. A dog showing 6-5-6 is clearly struggling. But the figures alone are crude instruments. A “1” achieved against weak opposition in A8 grade is not the same as a “1” in A2 grade. A “5” earned after being hammered at the first bend by a dog that ran across the track is not the same as a “5” on a clear run where the dog was simply not fast enough. The number tells you what happened. It does not tell you why.
Letters in the form string indicate specific events: “F” for a fall, “R” for a run-out (where the dog leaves the racing surface), “T” for a trial. These are important. A fall disrupts a dog’s confidence and may affect its behaviour in subsequent races. A trial indicates the dog has been off the racing scene and returned for a practice run, which suggests a break from competition and potentially unfamiliar current fitness. Each letter in the form string is a flag that warrants investigation, not a piece of noise to be skipped.
Sectional Times and Calculated Times
Sectional times — the split recorded from the traps to the first timing beam, usually positioned at or near the first bend — are the single most valuable speed metric on the race card. They tell you how fast the dog broke from the traps and how quickly it reached the first bend, which is the phase of the race that most strongly correlates with winning. A fast first-sectional runner is a front-runner, a dog that establishes position early. A slow first-sectional runner is a closer, a dog that relies on late pace to pick up positions through the bends and home straight.
Calculated time is the overall race time, sometimes adjusted by the racing manager to account for going conditions. The calculated time allows rough comparison between dogs that ran on different days and in different conditions, though the adjustment is imprecise and should be treated as a guide rather than an absolute. Two dogs with the same calculated time at the same distance have demonstrated similar overall speed, but their sectional profiles may be completely different — one may be a fast-early, slow-late runner and the other the reverse.
The combination of sectional and overall times reveals the dog’s speed distribution across the race. A dog that records a fast first sectional and a strong overall time is a complete performer. A dog with a fast sectional but a slow overall time is a front-runner that fades. A dog with a slow sectional but a rapid second half is a closer with strong finishing speed. Each profile has different implications for different race scenarios, and the race card provides both numbers for every recent run.
Weight, Season, and Comments
The dog’s racing weight is published on the card, typically in kilograms. Weight fluctuations between runs can indicate changes in condition: a dog that has gained a kilogram or more since its last run may be carrying extra condition that affects its speed, while a dog that has lost weight may be lighter and faster or, alternatively, may be losing condition due to illness or overracing. Significant weight changes — more than half a kilogram — are worth noting, though minor fluctuations are normal and usually insignificant.
Season status applies to female greyhounds. A bitch that is in season, or has recently been in season, may race differently from her normal form. Some trainers withdraw bitches during their season; others run them. The race card indicates the dog’s sex, and checking whether a bitch has raced recently enough for her season cycle to be relevant is a small but occasionally valuable piece of due diligence.
The race comment is the most underrated element on the card. Written by the track’s official race commentator, it describes each dog’s run in concise shorthand: “led from trap, held on,” or “slow away, crowded first bend, ran on late.” These comments contextualise the form figures in a way that no number can. A dog that finished fourth with the comment “badly baulked second bend, ran on well when in clear” has shown more than a dog that finished fourth with the comment “always behind, never dangerous.” The form figure is the same. The information content is entirely different.
Trap Draw Analysis: Beyond the Numbers
Trap position matters — but how much it matters depends entirely on the track. At a tight venue like Romford, where the first bend arrives almost immediately after the traps open, the inside draw is a measurable statistical advantage that persists across thousands of races. At a larger venue like Towcester, where the run to the first bend is longer and the bends are wider, the trap bias is mild and the draw is a secondary factor behind the dog’s ability. Treating trap bias as a universal constant is one of the most common analytical errors in greyhound betting. It is always track-specific, always distance-specific, and always subject to modification by weather and surface conditions.
Track-Specific Trap Bias Data
Every GBGB-licensed track accumulates a dataset of results from which trap bias can be calculated. The basic metric is the win rate by trap number: over a meaningful sample — several hundred races at a given distance — does Trap 1 win more often than the expected 16.7 percent for a six-dog field? Does Trap 6 win less often? The answers vary dramatically by venue.
At Romford’s 400-metre sprint, Trap 1 has historically produced a win rate well above the expected average, and Trap 6 well below. The gradient from inside to outside is steep and consistent, making the draw one of the most important factors in sprint analysis at that venue. At Monmore’s 480-metre standard distance, the gradient is flatter — all traps perform closer to the expected average, and the draw is less determinative. At Towcester’s longer distances, the bias is negligible in aggregate, and the quality of the dog matters more than its starting position.
The data is accessible. Form services publish trap statistics by track and distance, and any punter willing to compile results from the official form database can build their own bias tables. The work is not complicated — it is arithmetic applied to publicly available numbers — but it is work that most casual punters skip, which is precisely why it retains value. A bias table is a fixed reference point that changes slowly over time, and once built, it informs every race card you study at that venue.
Weather modifies the baseline. Wet conditions tend to amplify inside bias because the rail provides a cleaner running line when the surface is heavy. Dry, fast conditions reduce the advantage by allowing wider runners to maintain speed through the bends. The punter who checks the forecast before the meeting and adjusts their trap bias expectations accordingly is incorporating a variable that most bettors ignore.
How Vacant Traps Change the Race
When a dog is withdrawn and a trap runs empty, the race dynamics shift. A vacant trap creates a gap in the starting line that the adjacent dogs can exploit. A railer drawn in Trap 2 benefits if Trap 1 is empty, because the rail is uncontested and the dog can drift inside without meeting resistance. A wide runner in Trap 5 benefits from a vacant Trap 6 for the same reason — more space to establish its line.
The effect is not symmetrical. A vacant inside trap benefits the first outside dog more than a vacant outside trap benefits the first inside dog, because the inside line is inherently more valuable. The rail provides a guide through the bends, and a dog that can reach it without competition gains a positional advantage that compounds through every turn. Vacant traps in the middle of the field tend to have less impact because the space is filled quickly as the field compresses into the first bend.
Bookmakers adjust odds when a non-runner creates a vacant trap, but the adjustment is not always proportionate to the actual effect on the race dynamics. A dog drawn next to a vacant trap may see its price shorten, but the magnitude of the benefit depends on the specific track, the distance, and the running style of the dog involved. The punter who understands these interactions can assess whether the market’s adjustment is accurate, excessive, or insufficient — and bet accordingly.
Running Styles and How They Interact
Understanding which dogs lead and which close is the core skill of race visualisation. A greyhound’s running style — whether it is a front-runner that leads from the traps, a closer that picks up places late, or a mid-pack runner that sits behind the early pace and strikes in the second half — defines how it will behave in any given race. The style is partly innate temperament and partly physical profile. Lighter, faster-twitch dogs tend to break sharply. Heavier, longer-striding dogs tend to build through the race. Neither style is inherently superior. What matters is how the styles in a specific field interact with each other and with the trap draw.
A race with one confirmed front-runner and five closers will likely see the leader control the pace unopposed, hug the rail, and hold on in the straight. A race with three confirmed front-runners drawn across the inside traps will likely produce crowding, contact, and a scrappy first bend that benefits the closer coming through from behind. Reading the likely pace scenario before the race is the most direct application of running style analysis, and it is the step that transforms a collection of individual form assessments into a coherent race prediction.
The race card provides the raw material. The form comments describe each dog’s running style in shorthand: “led,” “handy,” “middle,” “wide,” “ran on,” “stayed on.” Sectional times quantify the early speed. The trap draw positions the runners relative to each other. Combining these elements produces a mental picture of how the first five seconds of the race are most likely to unfold, and those five seconds determine the shape of the remaining twenty-five.
Style clashes are where the value often lives. When two fast breakers are drawn in adjacent traps and will compete for the same space at the first bend, both face an elevated risk of interference. The market may not discount their chances sufficiently because the headline form — recent wins, fast times — looks strong for both. But the race dynamics created by their direct clash reduce the probability of either dog reproducing its best form. The closer drawn in space on the outside, meanwhile, benefits from the chaos in front of it, and its longer odds may understate its actual chance. This type of analysis is not speculative. It is a logical deduction from the data the race card provides.
Dogs are not completely locked into one style. A confirmed railer that encounters traffic on the inside may switch to a wider line. A closer in a slowly run race may find itself closer to the pace than usual. These adaptations happen in real time and are not always predictable. But the default style — the one the dog reverts to when unimpeded — is what you assess from the form card, and it is reliable enough to build your race model around.
Putting It Together: Pre-Race Assessment Workflow
Before looking at odds, build your own expectation of how the race will unfold. The odds are someone else’s assessment. Your job is to form your own, then compare the two. Where they agree, there is nothing to bet on. Where they disagree — where your assessment gives a dog a higher chance than the odds imply — there is a potential wager.
Start with the trap draw. Note which dogs are drawn where, and whether the allocation matches their running style. Flag any mismatches: a confirmed railer in Trap 5, a wide runner in Trap 2. These dogs face a structural disadvantage that their form figures may not reflect. Then map the pace. Identify the fastest breakers by their sectional times, note where they are drawn, and predict whether the early speed is concentrated on one side of the field or spread across it. A race with all the early pace drawn on the inside will unfold very differently from one with fast breakers on both the inside and outside.
Next, assess the form. Read the recent finishing positions in context: the grade, the track, the conditions, and — critically — the race comments. A dog that has finished third three times running may be consistently competitive or may have encountered trouble in all three races and has more ability than the figures suggest. The comments resolve the ambiguity. A form line of 3-3-3 with comments reading “led until crowded third bend” tells a completely different story from 3-3-3 with “always behind, no impression.”
Factor in the weight, the trainer, and any distance or surface changes from the dog’s most recent runs. A dog stepping up from 480 metres to 630 metres for the first time is racing into unknown territory, and its shorter-distance form may not translate. A dog returning from a break — indicated by a trial or a gap in its racing dates — may be rusty or may be freshened up; the trainer’s record with returning dogs provides a clue.
Finally, build the race in your mind. Which dog leads at the first bend? Which dogs are behind it, and on what line? Does the likely leader have the stamina to hold on, or does it typically fade? Is there a closer with the finishing speed to pick it up in the straight? The answer to these questions produces a predicted finishing order — your order, based on your analysis — which you then compare against the bookmaker’s odds. If the market agrees with your assessment, there is no bet. If the market disagrees, and you trust your analysis, there is your opportunity.
The Form Book Closes — Then Opens Again
Form is a lagging indicator, and greyhounds change faster than horses — that is both the challenge and the opportunity. A horse can race for ten years at the top level, building a form profile so deep that its ability is precisely calibrated by the market. A greyhound’s racing career is shorter, its physical peak is narrower, and its form can shift meaningfully between one race and the next. A dog that was an A3 performer last month may be an A2 performer this month, or it may have picked up a niggle that drops it to A5 level. The form book tells you what happened. It does not guarantee what will happen.
That volatility is precisely what makes greyhound form analysis rewarding. The market prices based on recent form, but recent form is a snapshot, not a trajectory. The punter who reads the race card not as a static record but as a set of signals about the dog’s direction — improving, peaking, declining, recovering — sees opportunities that the headline figures obscure. A dog with deteriorating form figures but improving sectional times is getting faster to the bend and encountering more trouble because of it. A dog with improving form figures but slowing times may be benefiting from easier competition rather than genuine improvement.
The race card hands you the evidence. The skill is assembling it into a story that is more accurate than the one the odds are telling. That skill does not arrive fully formed. It develops through repetition — reading cards, watching races, checking your predictions against results, and refining your process when the results reveal your mistakes. The form book closes on every race the moment the dogs cross the line. It opens again, fresh and full of signals, the moment the next card is published.
Get more form guides at greyhoundracinglegal.
Also read our greyhound racing form analysis.